Logs
This article is outdated and requires a revision.
Log config file location
Logging in Nethermind is done via NLog library that can be configured by editing the NLog.config file.
| Environment Type | NLog.config location |
|---|---|
| built from src - Debug mode | src\Nethermind\Nethermind.Runner\bin\Debug\netcoreapp3.1\NLog.config |
| built from src - Release mode | src\Nethermind\Nethermind.Runner\bin\Release\netcoreapp3.1\NLog.config |
| PPA | /usr/share/nethermind/NLog.config |
| Docker | /nethermind/NLog.config |
| from downloads page | top level directory after unzipping the package |
| from GitHub releases page | top level directory after unzipping the package |
| dAppNode | ? [to be documented] |
Log config file syntax
Detailed NLog configuration options can be found here: https://nlog-project.org/config/
Config or CLI log rules
Simple logging rules can be added through configuration file or command line argument.
For example this would add Trace level logs to any logger under Synchronization module and Debug level logs
for BlockTree from Blockchain module:
--Init.LogRules Synchronization.*:Trace;Blockchain.BlockTree:Debug
Global logging override
Additionally there are global logging override that you can use temporarily:
| Command line override | Log level |
|---|---|
| ./Nethermind.Runner --config mainnet --log TRACE | TRACE |
| ./Nethermind.Runner --config mainnet --log DEBUG | DEBUG |
| ./Nethermind.Runner --config mainnet --log INFO | INFO |
| ./Nethermind.Runner --config mainnet --log WARN | WARN |
| ./Nethermind.Runner --config mainnet --log ERROR | ERROR |
JSON RPC logging level
This can be done by including these lines in the logging configuration file:
<logger name="JsonRpc.*" minlevel="Error" writeTo="file-async"/>
<logger name="JsonRpc.*" minlevel="Error" writeTo="auto-colored-console-async" final="true"/>
<logger name="JsonRpc.*" final="true"/>
Enterprise Logging
See how to configure Seq here
Explaining Nethermind logs
You can check the supported operating systems, architectures and hardware requirements here: system-requirements.md
After the node starts, you will see some initial info about the node and then the sync will start. Görli fast sync uses
a fast blocks sync mode initially. The fast blocks sync picks some known pivot block from the past and
downloads headers, bodies, and receipts downwards all the way to genesis block. All blocks from 0 to
the pivot block are showed as Old Headers in the fast blocks sync logs. The console display shows the number
growing from 0 to pivot, but this is just to make the display more user-friendly.
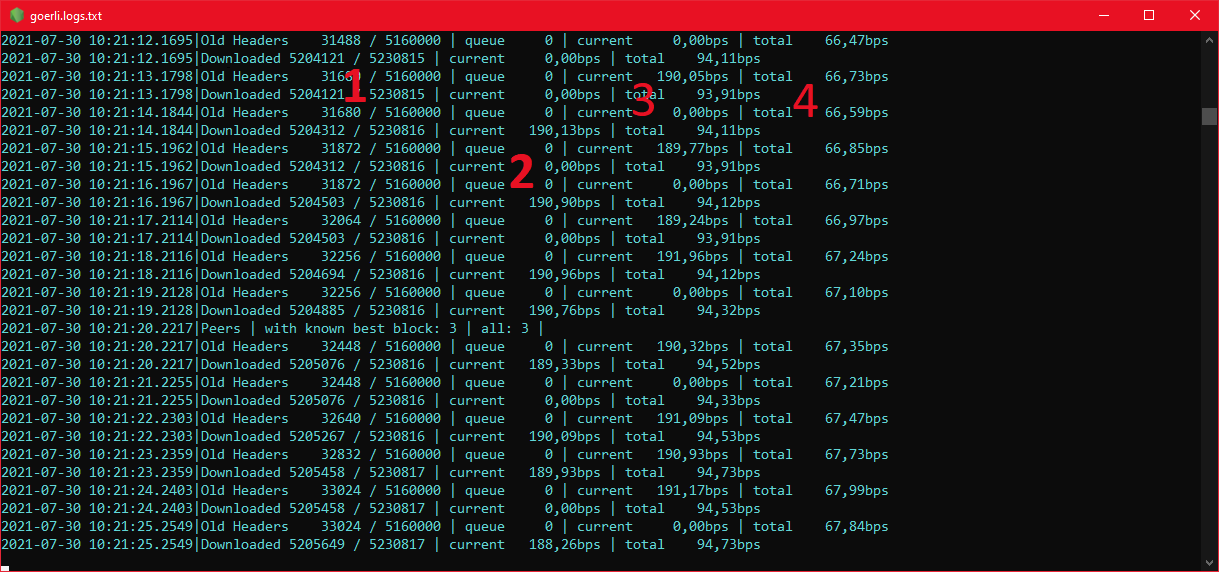
You will see some information about the sync progress, like below:
- Shows the number of already downloaded
headers,bodiesandreceiptsunder the nameDownloadedout of all to be downloaded in the fast blocks stage. - Shows the current queue of already downloaded
blocks,headersandreceiptswaiting for being saved to the database. - Shows the current download speed (blocks per second - bps).
- Shows the average download speed (blocks per second - bps).
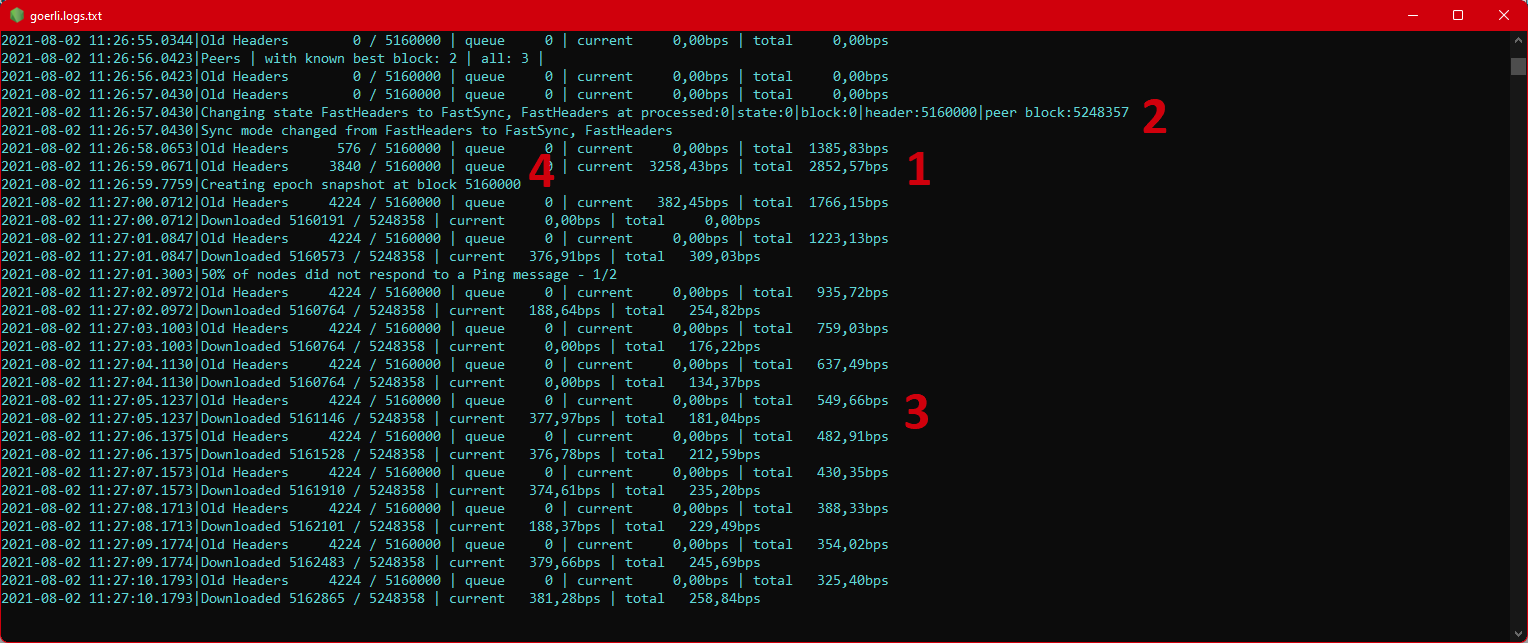
When the fast blocks stage finishes, there will be some period of downloading blocks between the pivot and
thelatest blocks which will have some additional info:
- Shows the last entry from the fast blocks stage.
- Shows the mode transition moment.
- Displays the speed (in blocks per second) of all
headers,bodiesandreceiptsat the same time. - Additional info will appear every 30000 blocks with information about the Görli epoch being stored.
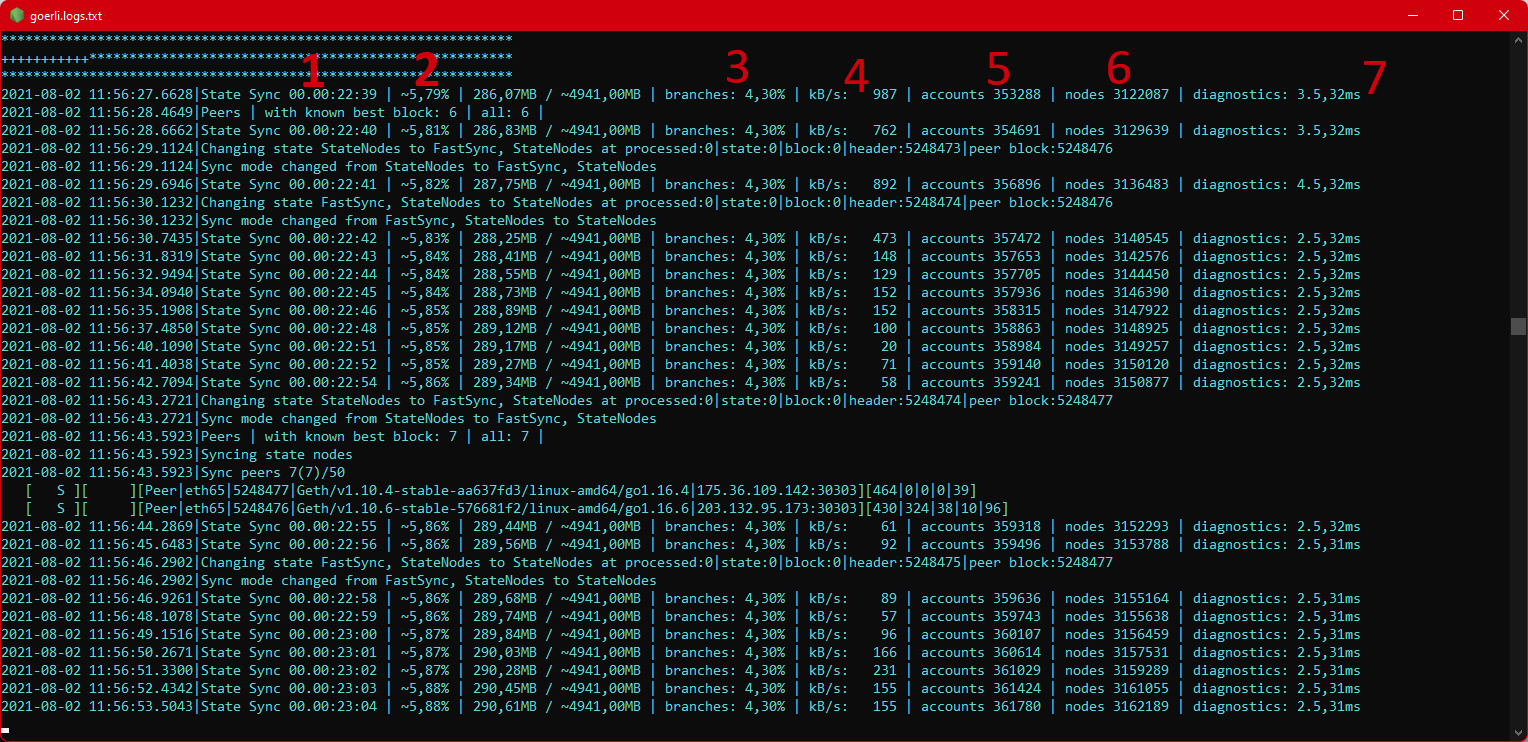
After the fast sync part finished, the node will transition to the state sync stage when the state trie is being
downloaded. Much information is displayed about the progress, as this process may take a long time on mainnet (a few
hours).
- Total elapsed time in
state syncis displayed. - The total percentage of downloaded DB size is displayed (on mainnet the sync finishes around 34GB in March 2020, on Görli around 800MB).
branchesstands for the percentage of downloaded branches.- Download speed in kilobytes per second is displayed.
accountsstands for the number of accounts data downloaded already.nodesstands for the number ofPatricia trie nodesdownloaded by the sync process.diagnosticshows the time spent in the DB write / read access. The higher the value, the worse. It may get much worse if you restart the node during the sync process, as we need to recreate some caches then by reading data from the DB.
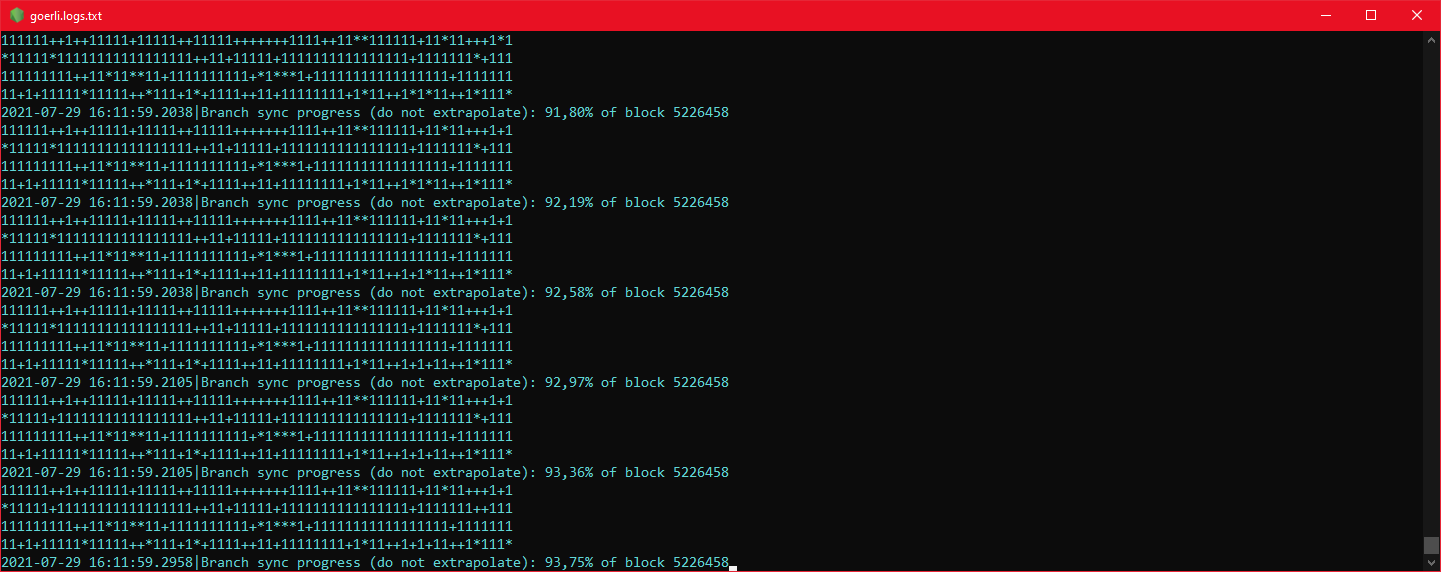
When the state sync is nearing completion, you may see a series of branch sync information reloading many times from
0% to nearly 100%. This is the node trying to retrieve the few remaining state nodes and progressing with the head block
rapidly:
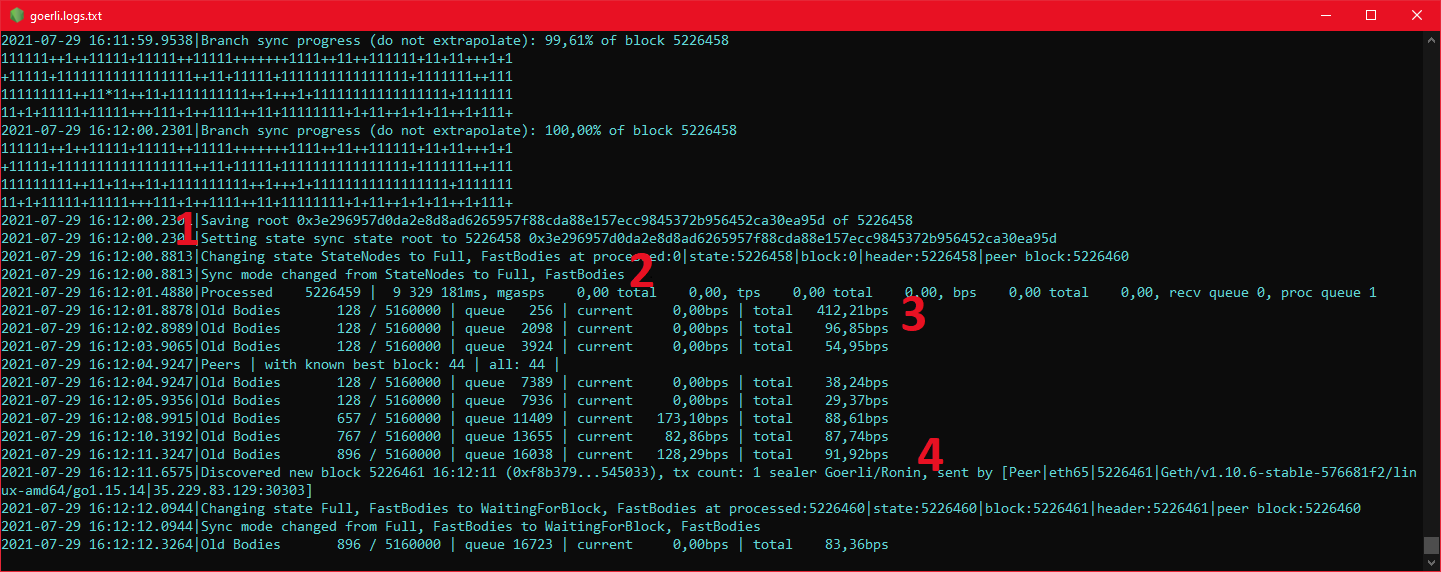
At some point, the entire state is downloaded and the node enters the full sync mode and will allow you to issue CLI /
Web3 queries and send / receive transactions🥳
- The
rootis saved at the moment when the entirePatricia trieis downloaded. - We also clearly state that the node transitions to the
full sync. - When you see the block being processed, then you are in the
full syncand the newly arrived block is being calculated. - Every two minutes you will see a summary of connected peers with their client version, IP address, highest synced block, and data download speeds.
Also, every now and then, a peer report will appear like below:

- First bracket is for Allocated contexts. It has possible values of
Hfor Headers,Bfor Bodies,Rfor Receipts,Nfor State,Sfor Snap, andWfor Witness. - Second bracket is for Sleeping contexts. It has possible values of
Hfor Headers,Bfor Bodies,Rfor Receipts,Nfor State,Sfor Snap, andWfor Witness. - Third bracket contains Peer Info.
- Fourth bracket is for Speeds as Follows:
- Latency
- Headers Transfer
- Bodies Transfer
- Receipts Transfer
- Node Data Transfer
- Snap Ranges Transfer
- Fifth bracket is for Client Info like Client Name, Client Version, Operating System and Language Version.