Logs
Processing logs
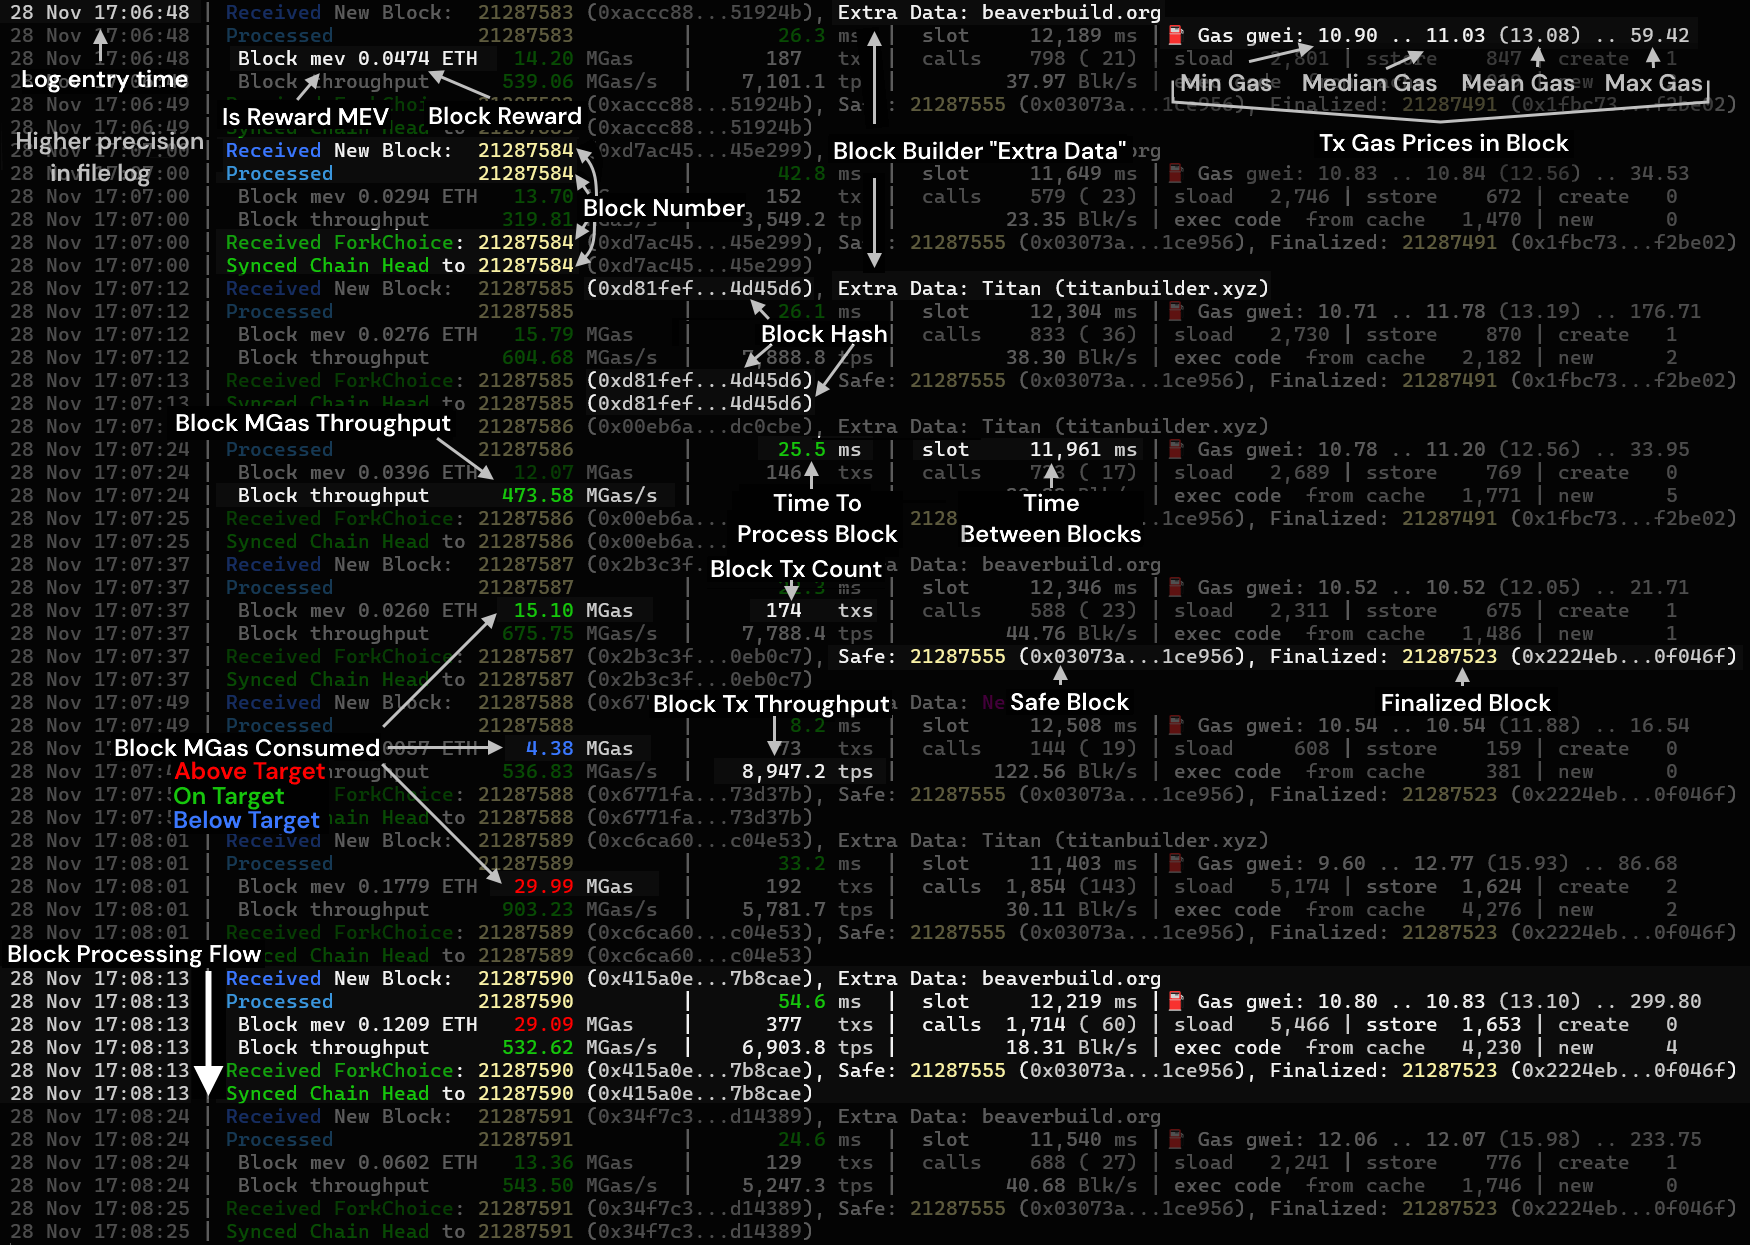
The Nethermind processing logs are a comprehensive resource for understanding Ethereum block processing. They provide real-time insights into block data, performance metrics, and the state of the blockchain.
Block metadata
- Block number: Current block being processed, e.g.,
21288004 - Block hash: Unique block identifier, e.g.,
0xf42e2a...8c5d7b - Extra data: Metadata given by the block builders; either interpreted utf8 string, hex data, or address if none provided
Block execution details
- Block reward: and whether it is a PBS
mevreward, e.g.,mev 0.0339 ETH - Total gas: consumed by block, e.g.,
16.08 MGas - Total transactions: in a block, e.g.,
162 txs - Calls: Total number of calls (including to EOAs), e.g.,
585 (13) sload: Number of storage reads, e.g.,1,865sstore: Number of storage writes, e.g.,618create: Number of contract deployments (and self-destructs), e.g.,10 (-2)- Gas prices: minimum, median, (mean), and maximum gas prices in gwei for block.
- Example:
14.65 gwei .. 14.65 (17.04) .. 55.00 gwei
- Example:
- Smart contracts:
- Run from code cache, e.g.,
exec code from cache 1,480 - Non-cached smart contracts loaded, e.g.,
new 2
- Run from code cache, e.g.,
Processing metrics
- Processing time: Time taken to validate a block, e.g.,
17.1 ms - Slot time: Time between blocks, e.g.,
12,318 ms - MGas/s: Processing speed in Millions of Gas per second, e.g.,
696.39 MGas/s - Transactions per second (TPS): Speed of transaction processing, e.g.,
9,457.6 tps - Blocks per second The number of these blocks that could be processed per second, e.g.,
28.53 Blk/s
Fork and sync events
- Received New Block: Block received with number, hash and extra data
21288296 (0xb61f74...cbfbe7), Extra Data: Titan (titanbuilder.xyz) - Processed: Block or block range processed, e.g., or
x4 21288291 .. 21288295or21288296 - Received ForkChoice: Updates on the blockchain's canonical chain; with safe and finalized block, e.g.,
21288296 (0xb61f74...cbfbe7), Safe: 21288252 (0x46906d...7777b8), Finalized: 21288221 (0x22a7d2...ebeae9) - Synced Chain Head: Latest synced block number and hash on the chain, e.g.,
21288296 (0xb61f74...cbfbe7)
Configuring logs
Alongside console logging, Nethermind also logs into a .log file named after the respective network configuration and located in the logs directory by default. The file name and location can be configured with the Init.LogFileName and Init.LogDirectory configuration options respectively.
Log levels
Nethermind uses the following log levels in descending by severity:
error: Indicates error conditions that impair some operation.warning: Signifies potential issues that may lead to errors or unexpected behavior in the future if not addressed.info: Includes messages with all the necessary information that a node operator may need.debug: Intended for logging detailed information for debugging purposes. Not recommended for production workloads for performance reasons.trace: The most verbose log level. As the name suggests, it's used for tracing and diagnostics purposes. Not recommended for production workloads for performance reasons.off: Turns off logging.
Not that setting a specific log level turns off messages with less severity while keeping messages with higher severity. For example, the info level logs the info warning error messages while ignoring the debug trace ones.
The log level can be configured with the -l, --log command line option. For instance:
nethermind \
  -c mainnet \
  --data-dir path/to/data/dir \
  -l debug
The above approach affects all of the Nethermind logs. For more fine-grained control, the Init.LogRules confuguration option comes at help. The example below sets the debug level for the BlockTree of the Blockchain module, and the trace level for any logger in the Synchronization module.
nethermind \
  -c mainnet \
  --data-dir path/to/data/dir \
  --init-logrules Blockchain.BlockTree:debug;Synchronization.*:trace
For even more control over logging, see the next section.
Advanced logging
Logging in Nethermind is highly configurable and uses the NLog library under the hood. The default location of the logging configuration file NLog.config is the Nethermind installation directory. For more information about the NLog.config, see the NLog configuration options.
The location of the NLog.config can be configured with the --logger-config command line options as follows:
nethermind \
  -c mainnet \
  --data-dir path/to/data/dir \
  --logger-config path/to/NLog.config
Enterprise-grade logging
Nethermind provides enterprise-grade logging out of the box using Seq. It's off by default and can be easily turned on, as in the following example:
nethermind \
  -c mainnet \
  --data-dir path/to/data/dir \
  --seq-apikey 9fs9V80bjlkgau9adsjH \
  --seq-minlevel info \
  --seq-serverurl https://seq.example.com
See the Seq configuration options.