Health check
This article is outdated and requires a revision.
Nethermind has a pre-packed Nethermind.HealthChecks.dll plugin that allows you to monitor your Nethermind node better.
It leverages the power
of AspNetCore.Diagnostics.HealthChecks. It simply adds
an/healthendpoint to the JSON RPC service which can be used to check the Nethermind's liveness - verify if the
node is synced and has at least one peer. Useful when you don't want to query the node before it's able to
provide you data available only for fully synced nodes like eth_getBalance.
The Nethermind.HealthChecks.dllplugin will be automatically loaded on Nethermind start.
Enabling and configuring Health Checks
The health checks need to be additionally enabled which can be done either through --HealthChecks.* flags or by adding
a "HealthChecks" section to the config file.
  "HealthChecks": {
    "Enabled": true,
    "WebhooksEnabled": true,
    "WebhooksUri": "https://slack.webhook",
    "UIEnabled": true,
    "PollingInterval": 10,
    "Slug": "/api/health"
  }
JSON RPC Service needs to be enabled in order for health checks to work --JsonRpc.Enabled true
Each configuration option is described here.
Enabling Health Checks without UI
./Nethermind.Runner --HealthChecks.Enabled true
The health endpoint is now available at localhost:8545/health by default (if your --JsonRpc.Port is 8545).
The health endpoint can be configured via --HealthChecks.Slug parameter e.g. --HealthChecks.Slug /api/health. We
can if it is working with curl:
// Request
curl localhost:8545/health

// Example of response for Unhealthy node
{"status":"Unhealthy","totalDuration":"00:00:00.0015582","entries":{"node-health":{"data":{},"description":"The node has 0 peers connected","duration":"00:00:00.0003881","status":"Unhealthy","tags":[]}}}

// Example of response for Healthy node
{"status":"Healthy","totalDuration":"00:00:00.0015582","entries":{"node-health":{"data":{},"description":"The node is now fully synced with a network, number of peers: 99","duration":"00:00:00.0003881","status":"Healthy","tags":[]}}}
- Unhealthy returns 503 (Service Unavailable) status code
- Healthy returns 200 status code
Enabling Health Checks UI
./Nethermind.Runner --HealthChecks.Enabled true --HealthChecks.UIEnabled true
Enabling UI will expose an additional endpoint /healthchecks-uiand will allow seeing node's health on a nice UI. To
view the UI simply go to http://localhost:8545/healthchecks-ui.
-09c7ba2b07d07480a303268d261ffd16.png)
Enabling Slack reports
We may also add Slack Webhook endpoint to which our node's health will be reported. We need to pass
the --HealthChecks.WebhooksEnabled true and add the --HealthChecks.WebhooksUri which can be found in your Slack app
configuration.
nethermind --HealthChecks.Enabled true --HealthChecks.UIEnabled true --HealthChecks.WebhooksEnabled true --HealthChecks.WebhooksUri https://hooks.slack.com/
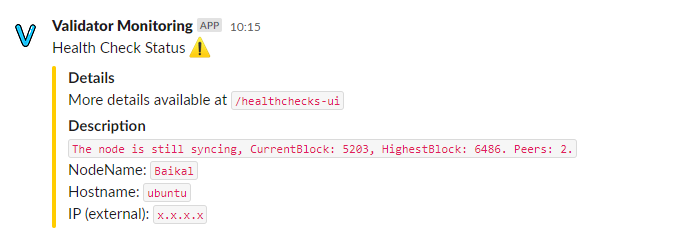
If your node will be Unhealthy you should receive a message similar to this:

with description of why the node is unhealthy, node's name and information about the machine on which the node is
running.
When it becomes Healthy (synced and with peers) you should receive:
-5eaf72852b3e686e71865323e9801102.png)
Consensus Client health
This check verifies if the client receives messages from the CL. If you see this warning in your logs, it means that there is something wrong with CL/Nethermind communication. Check more about setting up Nethermind and CL here.
No incoming messages from Consensus Client. Consensus Client is required to sync the node. Please make sure that it's working properly.
Note that Consensus Client is required for normal node operations.
health_nodeStatus
Health checks via JSON RPC requests were introduced in version v.1.10.18. For that, HealthChecks.Enabled should be
set to true.
- Request
- Response
{ "jsonrpc":"2.0","method":"health_nodeStatus","params":[],"id":67 }
{
    "jsonrpc": "2.0",
    "result": {
        "healthy": false,
        "messages": [
            "Sync degraded",
            "No messages from CL"
        ],
        "errors": [
            "SyncDegraded",
            "ClUnavailable"
        ],
        "isSyncing": true
    },
    "id": 67
}
Monitoring available storage space
Feature which is helping to track free disk space is enabled by default and monitors a drive which has been used to configure database location. There are two new configuration options available:
--HealthChecks.LowStorageSpaceWarningThreshold- Percentage of free disk space below which a warning will be displayed. If Health Checks UI is enabled, it will also be reported under node's health. Default value is 5 - meaning 5% of free disk space.--HealthChecks.LowStorageSpaceShutdownThreshold- Percentage of available disk space below which node will shutdown to avoid database corruption. Default value is 1 - meaning 1% of free disk space.
nethermind --HealthChecks.LowStorageSpaceWarningThreshold 5 --HealthChecks.LowStorageSpaceShutdownThreshold 1
HealthChecks for producing and processing blocks
There are two fields for HealthChecks config: MaxIntervalWithoutProcessedBlock and MaxIntervalWithoutProducedBlock. The node will return unhealthy status if the interval elapsed without processing or producing a block. Let's use the below config as an example. If the node doesn't process a block for 15 seconds, we will return unhealthy status. Analogically, we will be waiting 45 seconds for a newly produced block.
  "HealthChecks": {
    "Enabled": true,
    "WebhooksEnabled": true,
    "UIEnabled": true,
    "Slug": "/api/health",
    "MaxIntervalWithoutProcessedBlock ": 15,
    "MaxIntervalWithoutProducedBlock": 45
  }
If those fields are not set in a config, application will try to use them based on seal engine specification. If there is infinite time, unhealthy status can still be reported if processing or producing threads stopped.